nur für Forschungszwecke
BMS-309403 FABP4-Inhibitor
Kat.-Nr.S6622
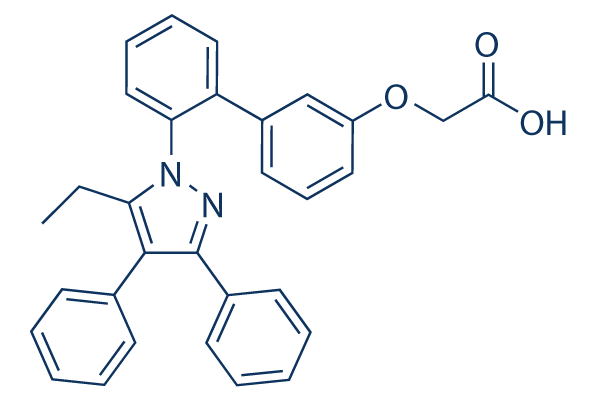
Chemische Struktur
Molekulargewicht: 474.55
Qualitätskontrolle
| Verwandte Ziele | Dehydrogenase HSP Transferase P450 (e.g. CYP17) PDE phosphatase PPAR Vitamin Carbohydrate Metabolism Mitochondrial Metabolism |
|---|---|
| Weitere FABP Inhibitoren | SBFI-26 ART26.12 |
Zellkultur, Behandlung & Arbeitskonzentration
| Zelllinien | Assay-Typ | Konzentration | Inkubationszeit | Formulierung | Aktivitätsbeschreibung | PMID |
|---|---|---|---|---|---|---|
| BL21(DE3) | Function assay | Displacement of 1,8-ANS from His6-tagged FABP4 (unknown origin) expressed in Escherichia coli BL21(DE3) cells by fluorescence assay, Ki=0.22μM | 27460668 | |||
| BL21(DE3) | Function assay | Direct binding to His6-tagged FABP4 (unknown origin) expressed in Escherichia coli BL21(DE3) cells by isothermal titration calorimetry, Kd=2.05μM | 27460668 | |||
| aP2+/+ macrophage cells | Function assay | 24 hrs | Decrease in MCP1 production in mouse aP2+/+ macrophage cells after 24 hrs | 17554340 | ||
| aP2-/-R macrophage cells | Function assay | 24 hrs | Decrease in MCP1 production in mouse aP2-/-R macrophage cells (re-expression of aP2) after 24 hrs | 17554340 | ||
| THP1 | Function assay | 25 uM | 3 days | Reduction of transformation of human THP1 cells to foam cells at 25 uM after 3 days relative to control | 17554340 | |
| aP2+/+ macrophage cells | Function assay | 25 uM | Reduction in total cholesterol ester content in mouse aP2+/+ macrophage cells at 25 uM relative to control | 17554340 | ||
| aP2-/-R macrophage cells | Function assay | 25 uM | Reduction in total cholesterol ester content in mouse aP2-/-R macrophage cells (re-expression of aP2) at 25 uM relative to control | 17554340 | ||
| THP1 | Function assay | 25 uM | Increase in APOA1-mediated cholesterol in human THP1 cells at 25 uM relative to control | 17554340 | ||
| THP1 | Function assay | 25 uM | Increase in ABCA1 mRNA level in human THP1 cells at 25 uM relative to control | 17554340 | ||
| THP1 | Function assay | 25 uM | Increase in ABCA1 protein level in human THP1 cells at 25 uM relative to control | 17554340 | ||
| aP2+/+ macrophage cells | Function assay | 25 uM | Increase in cholesterol efflux in mouse aP2+/+ macrophage cells at 25 uM relative to control | 17554340 | ||
| aP2-/-R macrophage cells | Function assay | 25 uM | Increase in cholesterol efflux in mouse aP2-/-R macrophage cells (re-expression of aP2) at 25 uM relative to control | 17554340 | ||
| THP1 | Function assay | Reduction of Mcp1 expression in human THP1 cells expressing aP2 relative to control | 17554340 | |||
| aP2+/+ macrophage cells | Function assay | Reduction of Mcp1 expression mouse aP2+/+ macrophage cells relative to control | 17554340 | |||
| aP2-/-R macrophage cells | Function assay | Reduction of Mcp1 expression mouse aP2-/-R macrophage cells (re-expression of aP2) relative to control | 17554340 | |||
| THP1 | Function assay | Reduction of IL1-beta expression in human THP1 cells expressing aP2 relative to control | 17554340 | |||
| aP2+/+ macrophage cells | Function assay | Reduction of IL1-beta expressed in mouse aP2+/+ macrophage cells relative to control | 17554340 | |||
| aP2-/-R macrophage cells | Function assay | Reduction of IL1-beta expressed in mouse aP2-/-R macrophage cells (re-expression of aP2) relative to control | 17554340 | |||
| THP1 | Function assay | Reduction of IL6 expression in human THP1 cells expressing aP2 relative to control | 17554340 | |||
| aP2+/+ macrophage cells | Function assay | Reduction of IL6 expression mouse aP2+/+ macrophage cells relative to control | 17554340 | |||
| aP2-/-R macrophage cells | Function assay | Reduction of IL6 expression mouse aP2-/-R macrophage cells (re-expression of aP2) relative to control | 17554340 | |||
| THP1 | Function assay | Reduction of TNF expression in human THP1 cells expressing aP2 relative to control | 17554340 | |||
| aP2+/+ macrophage cells | Function assay | Reduction of TNF expression in mouse aP2+/+ macrophage cells relative to control | 17554340 | |||
| aP2-/-R macrophage cells | Function assay | Reduction of TNF expression mouse aP2-/-R macrophage cells (re-expression of aP2) relative to control | 17554340 | |||
| Klicken Sie hier, um weitere experimentelle Daten zu Zelllinien anzuzeigen | ||||||
Chemische Informationen, Lagerung & Stabilität
| Molekulargewicht | 474.55 | Formel | C31H26N2O3 |
Lagerung (Ab dem Eingangsdatum) | 3 years -20°C powder |
|---|---|---|---|---|---|
| CAS-Nr. | 300657-03-8 | -- | Lagerung von Stammlösungen |
|
|
| Synonyme | N/A | Smiles | CCC1=C(C(=NN1C2=CC=CC=C2C3=CC(=CC=C3)OCC(=O)O)C4=CC=CC=C4)C5=CC=CC=C5 | ||
Löslichkeit
|
In vitro |
DMSO
: 95 mg/mL
(200.18 mM)
Ethanol : 18 mg/mL Water : Insoluble |
Molaritätsrechner
|
In vivo |
|||||
In-vivo-Formulierungsrechner (Klare Lösung)
Schritt 1: Geben Sie die untenstehenden Informationen ein (Empfohlen: Ein zusätzliches Tier zur Berücksichtigung von Verlusten während des Experiments)
Schritt 2: Geben Sie die In-vivo-Formulierung ein (Dies ist nur der Rechner, keine Formulierung. Bitte kontaktieren Sie uns zuerst, wenn es im Abschnitt "Löslichkeit" keine In-vivo-Formulierung gibt.)
Berechnungsergebnisse:
Arbeitskonzentration: mg/ml;
Methode zur Herstellung der DMSO-Stammlösung: mg Wirkstoff vorgelöst in μL DMSO ( Konzentration der Stammlösung mg/mL, Bitte kontaktieren Sie uns zuerst, wenn die Konzentration die DMSO-Löslichkeit der Wirkstoffcharge überschreitet. )
Methode zur Herstellung der In-vivo-Formulierung: Nehmen Sie μL DMSO Stammlösung, dann hinzufügenμL PEG300, mischen und klären, dann hinzufügenμL Tween 80, mischen und klären, dann hinzufügen μL ddH2O, mischen und klären.
Methode zur Herstellung der In-vivo-Formulierung: Nehmen Sie μL DMSO Stammlösung, dann hinzufügen μL Maisöl, mischen und klären.
Hinweis: 1. Bitte stellen Sie sicher, dass die Flüssigkeit klar ist, bevor Sie das nächste Lösungsmittel hinzufügen.
2. Achten Sie darauf, das/die Lösungsmittel der Reihe nach hinzuzufügen. Sie müssen sicherstellen, dass die bei der vorherigen Zugabe erhaltene Lösung eine klare Lösung ist, bevor Sie mit der Zugabe des nächsten Lösungsmittels fortfahren. Physikalische Methoden wie Vortex, Ultraschall oder ein heißes Wasserbad können zur Unterstützung des Lösens verwendet werden.
Wirkmechanismus
| Targets/IC50/Ki |
FABP4
(Cell-free assay) 4 nM(Kd)
|
|---|---|
| In vitro |
Die Behandlung mit BMS309403 (FABP4-Inhibitor) in Kombination mit SSO (CD36-Inhibitor) verringert die Lebensfähigkeit, Proliferations-, Migrations- und Invasionsfähigkeiten von Brustkrebszellen über 72 Stunden signifikant. Die Hemmung bei empfohlenen Konzentrationen verringert die Lebensfähigkeit von Brustkrebszellen über 72 Stunden nicht signifikant. Die Behandlung mit SSO und dieser Verbindung führt zu einer Zellaggregation und einem erhöhten Lipidgehalt, was auf eine Unfähigkeit zur Verstoffwechselung von Lipiden hindeutet, die möglicherweise zu einer Lipotoxizität-induzierten Apoptose führt. |
| In vivo |
Die Behandlung mit BMS309403 oder SSO allein verringert die Rate der Tumorentstehung, und die Kombination dieser Verbindung und SSO verringert die Rate der Tumorentstehung signifikant. |
Literatur |
|
Technischer Support
Tel: +1-832-582-8158 Ext:3
Wenn Sie weitere Fragen haben, hinterlassen Sie bitte eine Nachricht.
Produkte sind nur für Forschungszwecke bestimmt. Nicht für den menschlichen Gebrauch. Wir verkaufen nicht an Patienten.
©Copyright 2013 Selleck Chemicals. Alle Rechte vorbehalten.